Lynda.com Login Help
Lynda.com videos are free to Virginia Tech students with your VT.EDU login. Start at the VT.EDU login page to access these resources.
On Thursday, our #InfographicInspiration explained background information on Gantt Charts, identified their basic characteristics, and outlined their strengths. As you probably recall, Gantt charts are one of the ways that you can organize the schedule for your project to make the details clear and easy to follow.
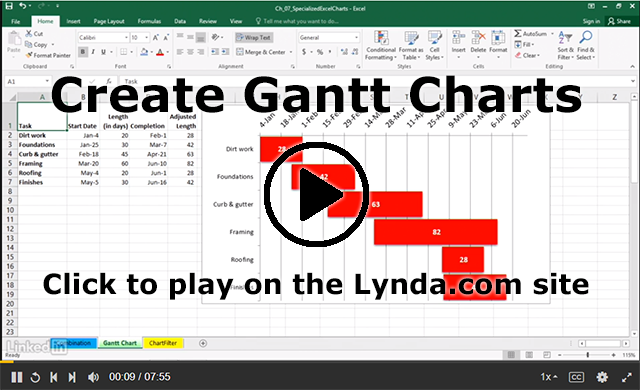
Today’s #WeekendWatch is a Lynda.com video that explains, step-by-step, how to use Excel 2016 to Create Gantt charts (7m55s). Videos are also available for these versions of Excel:
After watching the video, check out the contents for Excel 2016: Charts in Depth, the course that the Gantt Charts video is part of. It includes details on several other kinds of charts and more advanced information on using Excel to create charts.
If you are curious about Gantt charts, you can also watch the Lynda.com video Learning Gantt Charts (1h17m).
Note: This video has closed captioning, so it does not need a transcript.