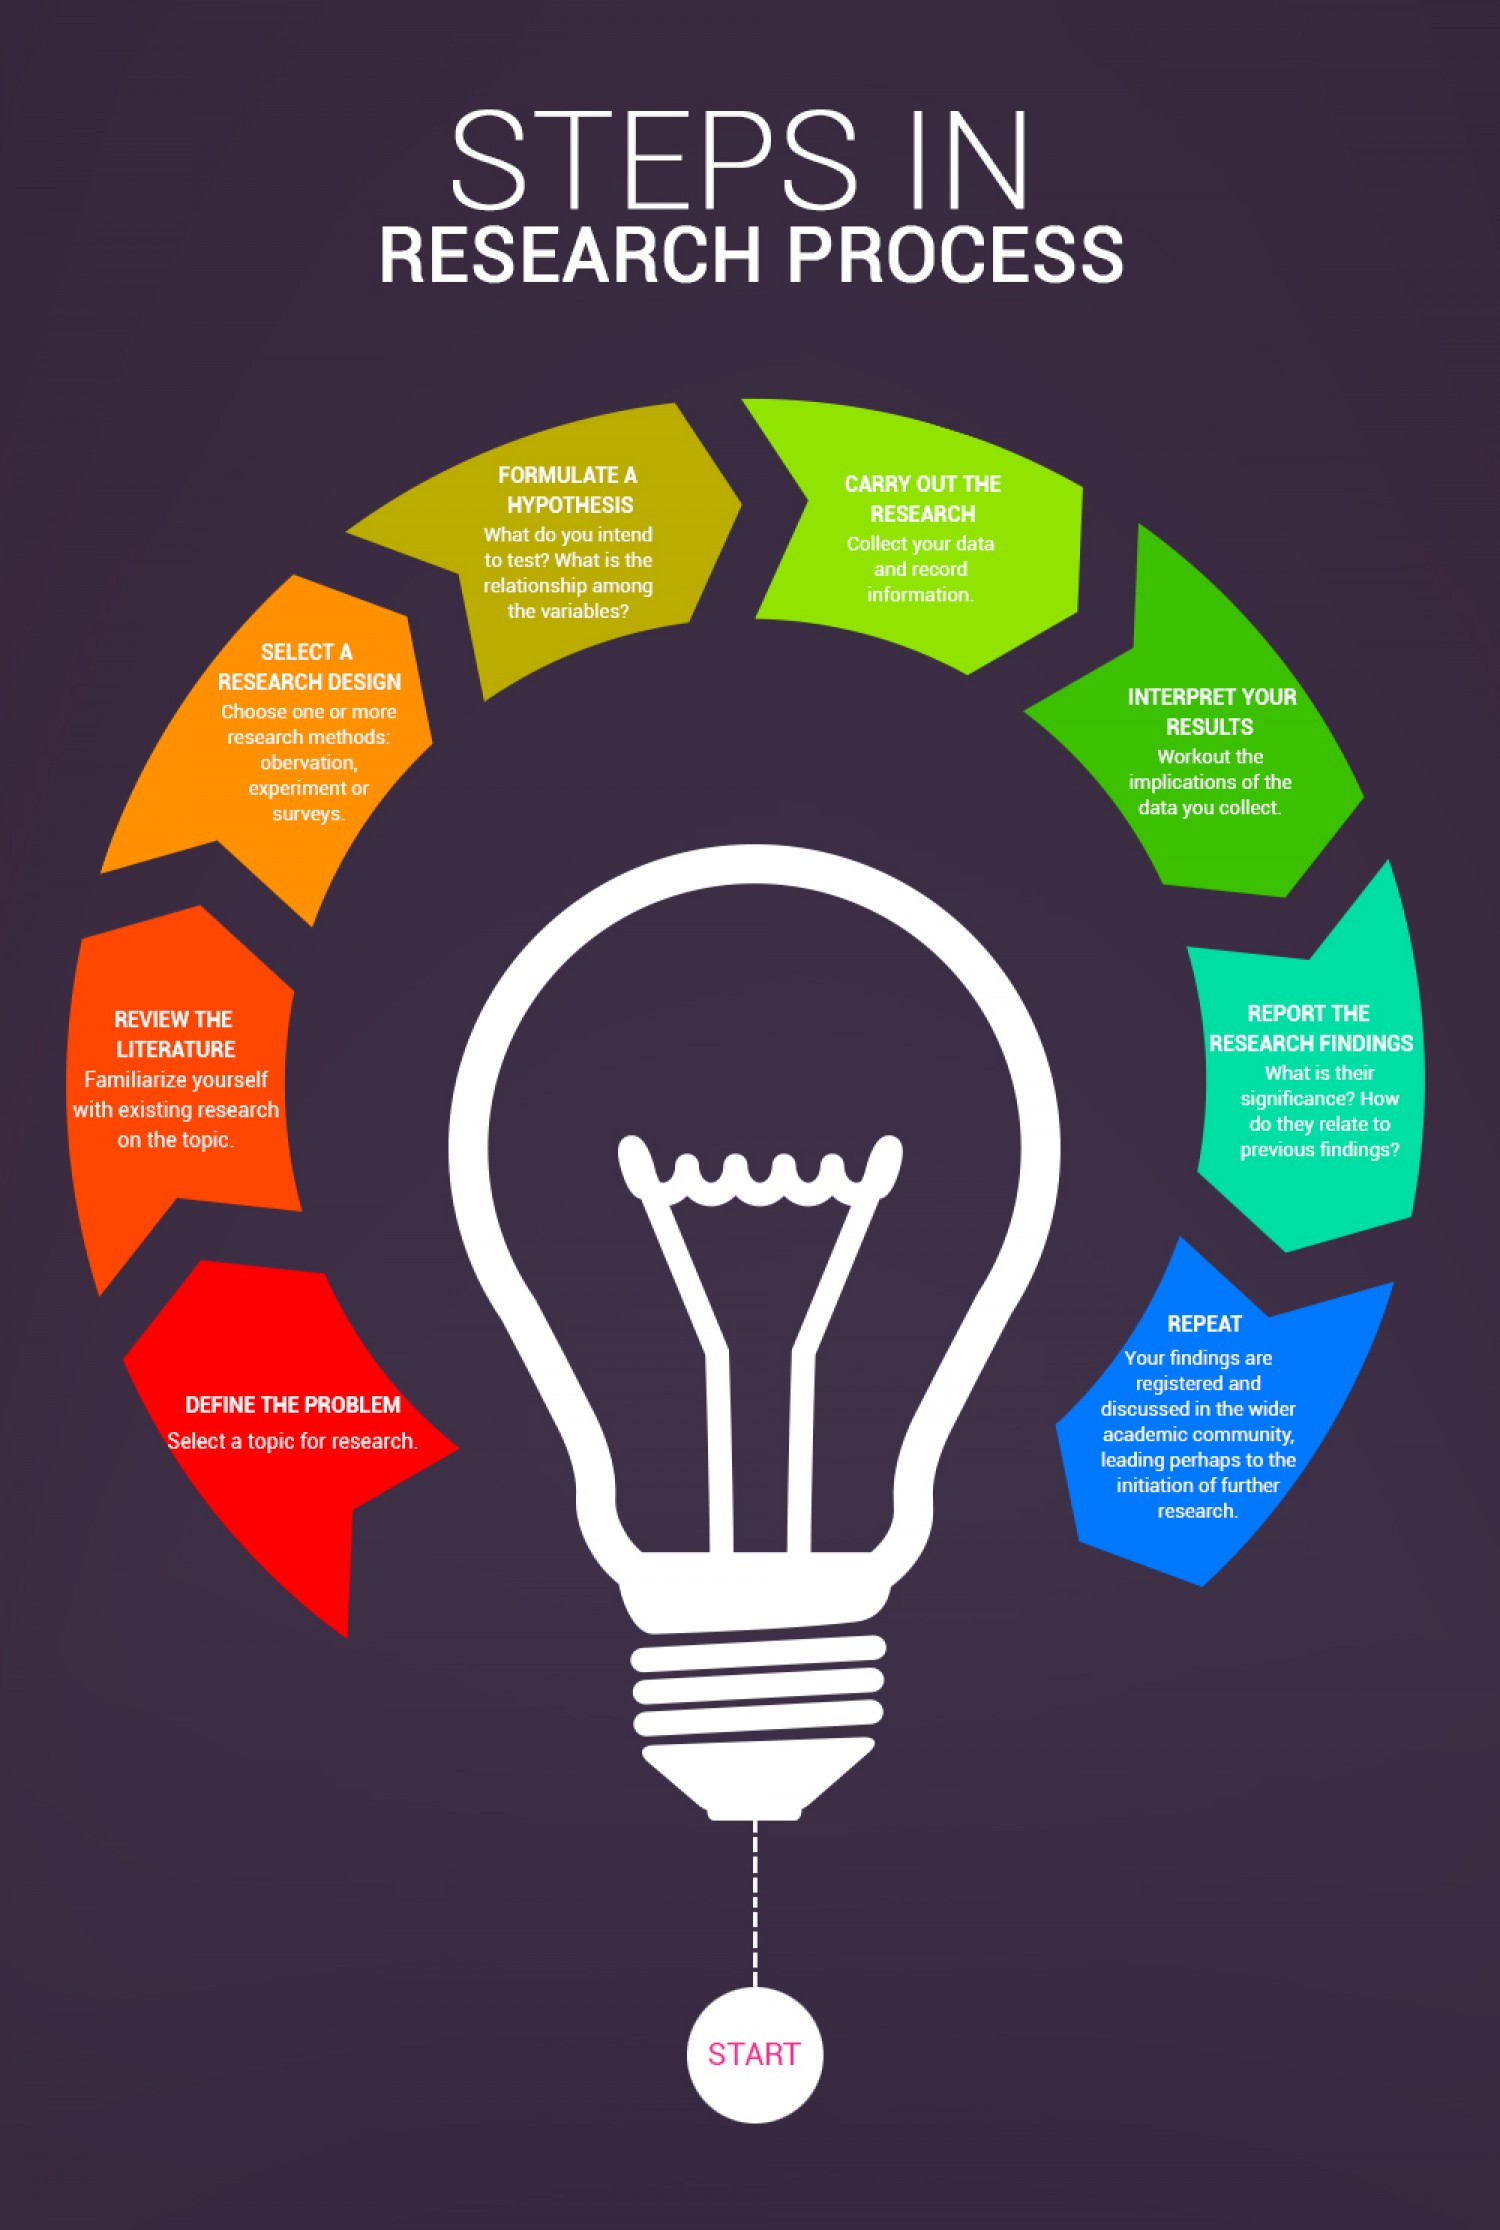
Since you are gathering information for your Genre Analysis Report this week, our #InfographicInspiration for focuses on the research process. The image below breaks the research process into eight steps that are typical for academic projects.
Your Genre Analysis Report probably includes the steps in this infographic, except perhaps the final step “Repeat.” It’s important to realize that research, like most creative projects, can take a much messier route than the infographic suggests. People rarely march through research in a 1-2-3 order. They back up, jump ahead, and redo.
As you look at this infographic, compare it to the way that you usually work. You might comment on any of the following:
- How is your process the same as the one in the infographic?
- How is your process different than the one in the infographic?
- What steps do you follow that are not represented in the infographic?
- If you created a visualization of your research process, what would it look like?
- If the infographic inspires you to talk about something not covered in these questions, tell us about it.
Note: This infographic needs a text-based transcript. See the Optional Accessibility Transcript Activity for more details.